
Creating and Using Moving Averages with the Research Wizard
Did you know you can create and scan for Moving Averages with the Research Wizard?
You can.
While the Research Wizard is one of the most powerful fundamental stock picking and backtesting programs available, many are not aware that the Research Wizard can also scan and test things like Moving Averages and Increasing (or Decreasing) Volume and etc.
What is a Moving Average?
Moving averages are great in helping to determine if a market (stock) is in an uptrend or downtrend and if a trend change is/has taken place.
Moving averages act as trendlines (albeit moving and curved) in that as the stock trades above the moving average, it's bullish whereas if it trades below it, it's bearish.
Short-term moving averages help gauge the short-term direction of the market while longer-moving averages take a bigger picture view.
An example of a shorter-term moving average would be the 10 day (two week) moving average or 20 day (four week) moving average. (The below image shows a 10 day moving average.)

The 10 day moving average is just that; the average of the last 10 days of prices. Each day the average price changes as the most recent day's price is included and the oldest price drops off. As the stock's price increases, the moving average's price increase as well. If the stock's price decreases, the moving average price will also decrease.
An example of an intermediate-term moving average would be a 50 day (or ten week) moving average. Once again, the most recent day's price is included while the oldest price is no longer included.
Of course, one day's price out of a possible 10 days of prices will have a greater influence on the moving average price than one day out of 50 days of prices. So the shorter the number of days included in the moving average, the more sensitive it's considered.
A longer-term moving average example would be the 200 day (or forty week) moving average. As long as the stock trades above it, the longer-term trend is considered intact. If a stock breaks the 200 day moving average on its way down, that's generally thought to be bearish, and the longer-term trend could be reversing. It'll take more price action over a longer period of time to influence this moving average.
Support and Resistance
Just like trendlines, moving averages can act as support and resistance.
If a stock comes down, but stops at or around the moving average and then starts moving higher from there, it can act as a firm underpinning of support for the stock.
If a stock is trading below the moving average and rises up to the underside of it but is turned away and goes lower, the moving average has acted as upside resistance.
Note: Moving Averages are less exacting than trendlines when acting as support and resistance. And shorter-term moving averages are not as robust as longer-term moving averages in this regard. Although it should be noted too that shorter-term trendlines are also not as robust as longer-term trendlines either.
How to Use Moving Averages in the Research Wizard
Screening for Moving Averages
To build a moving average in the Research Wizard, we'll do this in the Calculation Expression feature.
In this example: let's screen for stocks trading above their 200 day moving average.
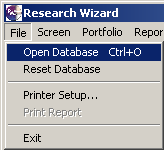
1. First, let's switch to our DBDP (Historical Daily Prices) database by going to File on the Menu Bar and selecting Open Database.
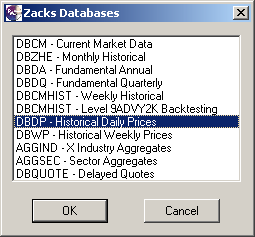
2. Then select the DBDP - Historical Daily Prices database and click OK.
3. You'll then be back to the Main Page. From there, go to the Screen on your Menu Bar and select Screen by Calculation Expression,
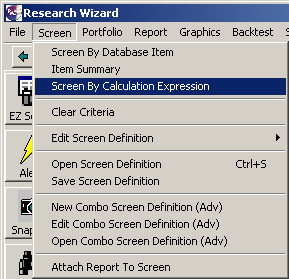
or click on the Screen by Calculation Expression button on the Toolbar.

The Calculation Expression Window will then pop up.
4. In the Categories Window, select Price and Volume Data. And in the Items Window, select Daily Price. (Shown below.) (Notice next to Daily Price, it has (560 D) in parentheses. That means there's 560 days worth of data points to choose from.)
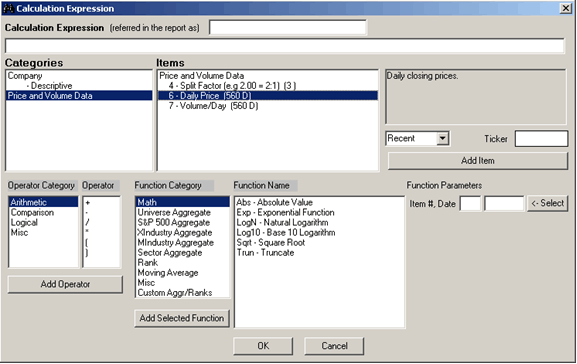
5. Click the Add Item Button,

and then i6 (Daily Price) will be added to the long dialog box above the Categories and Items windows. (See below.)

6. Then in the lower left corner, go to the Operator Category window and select Comparison. In the Operator window to the right of it, select the > sign. Then click Add Operator when done. (See below.)
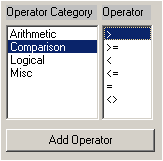
The long dialogue box will now read: i6 >
7. Then, making sure that Daily Prices is still highlighted in the Items window, go to the Function Parameters section and click on the 'Select' button. (You'll see the two boxes populate with 6 (meaning item # 6) and Recent.

8. Next, in the Function Category window, highlight Moving Average. Then in the Function Name window, highlight Moving Mean. Then in the Number of Periods box, type in 200 as shown below. (That means 200 days.) And then click the Add Selected Function button.
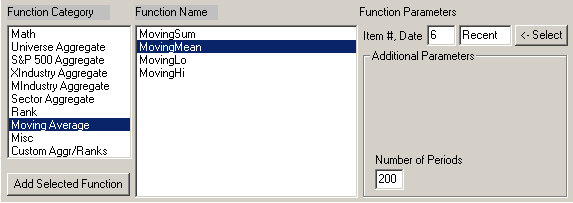
The long dialogue box will read: i6 > MovingMean200(i6) as shown below.

9. Click the OK button at the bottom to complete the Calculation Expression.
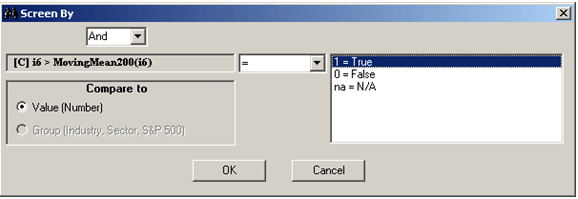
10. The Screen By window will then pop up. Make sure the operator displays the ' = ' sign. Then highlight the 1 = True selection and click OK. (See below.)
If done correctly, the Screen Definition table and the Report Definition table will look like the image below.

Click the Run Query button and only stocks trading above their 200 day moving average will come thru.
From the report page, select a ticker by left clicking it once, then right clicking it so a Menu pops up (as shown below).

Then left click the Interactive Charts and ZER selection and your Chart window displays. (See below.)
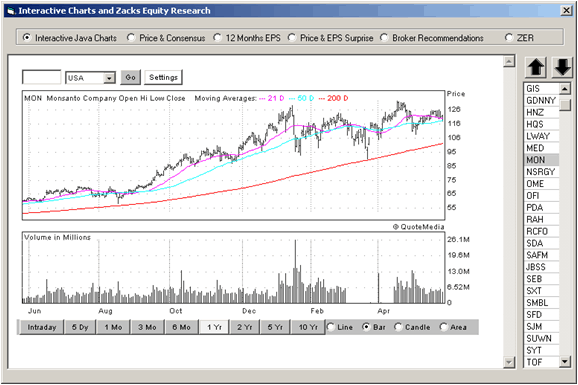
The Chart window lets you scroll thru all of the screened tickers by clicking the Up Arrow button and the Down Arrow button. (As a default, the 200 day moving average will be displayed in red.)
When you're done looking at the stocks, make sure to go back and save your screen if you don't wan to lose it.
Moving Average Crossovers
You can also screen for moving average crossovers too.
For example: you could screen for stocks where the 10 day moving average is above the 20 day moving average. This will return stocks like the one depicted in the image below. When the longer-term moving average is above the shorter-term moving average, it's considered bearish. In the below image, the purple line is the shorter-term (or faster) 10 day moving average and the blue line is the longer-term (or slower) 20 day moving average. (This is bullish.)

In the previous example, we went step by step in screening for stocks where the current price was greater than the 200 day moving average.
In this next example, let's look for stocks where the 50 day moving average is greater than the 200 day moving average.
First, clear out your criteria by clicking on the Garbage Can button on your Tool Bar.

Then repeat step 1 thru 3 as described above.
4. In the Categories Window, select Price and Volume Data. And in the Items Window, select Daily Price. (Shown below.)

5. Then, go to the Function Parameters section and click on the 'Select' button. (You'll see the two boxes populate with 6 (meaning item # 6) and Recent.

6. Next, in the Function Category window, highlight Moving Average. Then in the Function Name window, highlight Moving Mean. Then in the Number of Periods box, type in 50 as shown below. And then click the Add Selected Function button. (This is the 50 day moving average.)
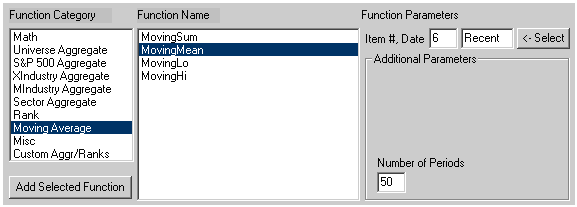
The long dialogue box will read: MovingMean50(i6) as shown below.

7. Then in the lower left corner, go to the Operator Category window and select Comparison. In the Operator window to the right of it, select the ' > ' sign. Then click Add Operator when done. (See below.)
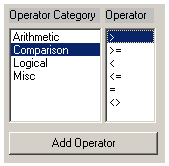
The long dialogue box will now read: MovingMean50(i6) >
8. Then, making sure that the Function Category window still has Moving Average highlighted and that the Function Name window still has Moving Mean highlighted, change the Number of Periods box to 200 as shown below and then click the Add Selected Function button. (This is the 200 day moving average.)
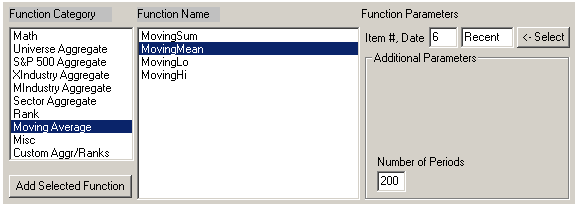
The long dialogue box will read: MovingMean50(i6) > MovingMean200(i6) as shown below.

9. Click the OK button at the bottom to complete the Calculation Expression.
10. The Screen By window will then pop up. Make sure the operator displays the ' = ' sign. Then highlight the 1 = True selection and click OK. (See below.)
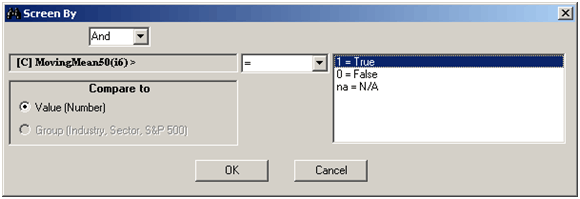
If done correctly, the Screen Definition table and the Report Definition table will look like the image below.

Click the Run Query button and only stocks whose 50 day moving average is above their 200 day moving average will come thru.
(Again, make sure to go back and save it if you want to keep it for later use.)
Backtesting Moving Averages
If you want to backtest a screen with moving averages, be sure you create your moving average in the DBCMHIST database.
The moving average screens we just created in the DBDP database (Historical Daily Prices database), cannot be backtested.
But if you create the moving average in the Weekly Historical Database (DBCMHIST) it can be.
First, clear out your criteria by clicking on the Garbage Can button on your Tool Bar.

In this example, let's look for stocks where the 50 day (or 10 week) moving average is greater than the 200 day (or 40 week) moving average.
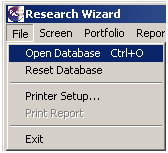
1. First, let's switch to our DBCMHIST (Weekly Historical) database by going to File on the Menu Bar and selecting Open Database.
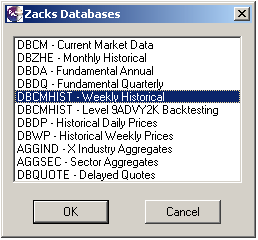
2. Then select the DBCMHIST - Weekly Historical Database and click OK.
3. You'll then be back to the Main Page. From there, go to the Screen on your Menu Bar and select Screen by Calculation Expression,
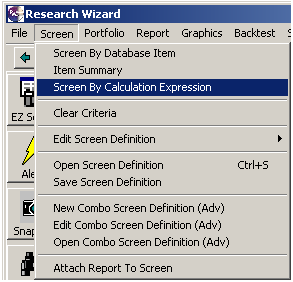
or click on the Screen by Calculation Expression button on the Toolbar.

The Calculation Expression Window will then pop up.
4. In the Categories Window, select Price and Price Changes. And in the Items Window, select Current Price. (Shown below.) (Notice next to Current Price, it has (260 Wk) in parentheses. That means there's 260 weeks worth of data points to choose from.)
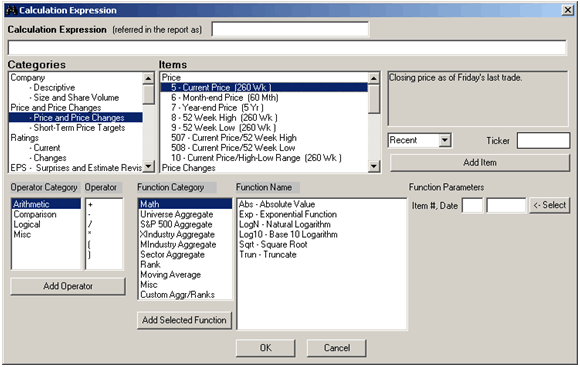
5. Then, go to the Function Parameters section and click on the 'Select' button. (You'll see the two boxes populate with 5 (meaning item # 5) and Recent.

6. Next, in the Function Category window, highlight Moving Average. Then in the Function Name window, highlight Moving Mean. Then in the Number of Periods box, type in 10 as shown below. And then click the Add Selected Function button. (This is the 10 week moving average -- the approximate equivalent to the 50 day moving average.)
Note: the Number of Periods box references the periodicity of the item's data points. If the item's history is stored as daily data points; 10 would mean 10 days. If the item's history is stored as weekly data points; 10 would mean 10 weeks.)
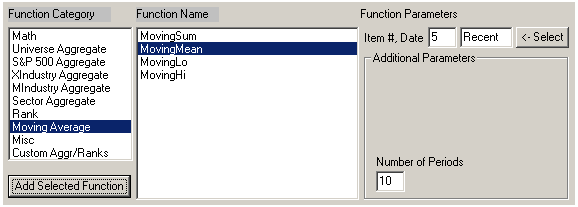
The long dialogue box will read: MovingMean10(i5) as shown below.

7. Then in the lower left corner, go to the Operator Category window and select Comparison. In the Operator window to the right of it, select the ' > ' sign. Then click Add Operator when done. (See below.)
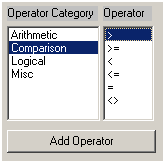
The long dialogue box will now read: MovingMean10(i5) >
8. Then, making sure that the Function Category window still has Moving Average highlighted and that the Function Name window still has Moving Mean highlighted, change the Number of Periods box to 40 as shown below and then click the Add Selected Function button. (This is the 40 week moving average - the approximate equivalent to the 200 day moving average.)
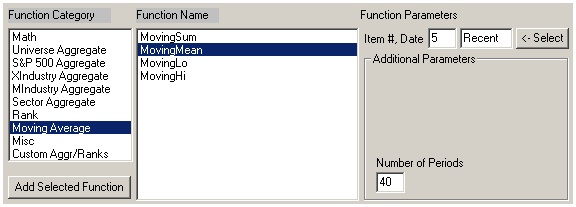
The long dialogue box will read: MovingMean10(i5) > MovingMean40(i5) as shown below.

9. Click the OK button at the bottom to complete the Calculation Expression
10. The Screen By window will then pop up. Make sure the operator displays the ' = ' sign. Then highlight the 1 = True selection and click OK. (See below.)
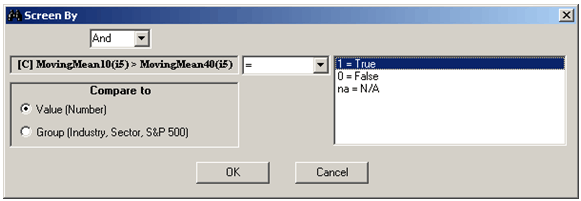
If done correctly, the Screen Definition table and the Report Definition table will look like the image below.

Click the Run Query button and only those stocks whose 10 week moving average is above their 40 week moving average will come thru.
For shorter-term moving averages, you would do it the same way, but change the Numbers of Periods box to 4 for weeks (or the approximate equivalent of 20 days) or 2 for two weeks (or the approximate equivalent of 10 days).
To add more items to this screen, simply return to the main DBCM database and continue to build upon this screen.
Go to File, Open Database and select Reset Database. This will take you back to the default DBCM database where you can finish the rest of your screen.
Then be sure to save your screen if you want to use it for later or if you want to backtest it.
To backtest this screen, simply backtest it like you would any other screen.
Summary
Using a screener to find and test different moving averages can be quick and easy and potentially profitable.
Of course, moving averages alone don't tell the whole story. But a company with solid fundamentals, while also trading above these trend indicators, can help you find winning stocks. And they can also alert you to trend changes too.
Get It
The Research Wizard already comes with a screen called:
sow_10_20_50_200_ma.
It looks for companies that are trading above their 10, 20 50 and 200 day moving average along with some other criteria. You can access it by going to:
Screen
Open Screen Definition
Double-click on the SoW folder
Select the sow_10_20_50_200_ma.und file
Click Open
You can also access a backtestable 2 week, 4 week, 10 week and 40 week moving average screen as well. It's a starter screen so you can build upon it as you wish. Go to:
Screen
Open Screen Definition
Double-click on the SoW folder
Select the bt_sow_2wk_4wk_10wk_40wk_ma.und file
Click Open
Free Daily Picks from Zacks' Best Strategies
Plus, Formulas for Finding Them on Your Own
Try our Research Wizard stock-selection program for 2 weeks to access live picks from our proven strategies, modify existing screens, or test and create your own at the touch of a button. Absolutely free and no credit card needed.