
How to Create and Backtest Projected EPS Growth Rates
When it comes right down to it, a Company's fortune will rise and fall based on its ability to grow its business and earn profits.
Historical Earnings Growth is important. Has the Company been profitable in running its business? Is it maximizing its potential? How does it stack up to its competitors? These are all important questions. And the Research Wizard can answer them all – thru Screening and Backtesting.
Projected Growth Rates are just as important – if not more so. How a Company has done is good to know. But how a company is forecast to do is critical.
Since the stock market is forward looking, a weak outlook will likely be met with lower prices. Historical Growth Rates notwithstanding, lower future earnings usually means lower stock prices.
But a strong outlook shows the Company is on the right track. And a robust projected growth rate will likely be rewarded with higher prices.
From the main screening page, you can access the Year over Year Estimated Projected Growth Rate item (Est. One Year EPS Growth F(1)/F(0)) by going to:
- Growth (in the Categories window)
- selecting EPS Projected sub-category
- then in the Items Window, selecting Est. One Year EPS Growth F(1)/F(0)
(under Annual (next yr/yr) - double click the item with your left mouse and complete the screen as you normally would
Note: this pre-defined item cannot be backtested.
However, you can create a Projected Growth Rate item that CAN be backtested. This can be done with the Calculation Expression feature.
Creating the Estimated One Year EPS Growth Rate item for Backtesting
Before we begin, let's first go over the definition of the pre-defined Estimated One Year EPS Growth item. The definition is:
F(1) Earnings Estimate minus the F(0) Actual Earnings (or the Consensus if the Actual is not yet reported) divided by the absolute of either the Actual F(0) or the F(0) Consensus.
The definition box above the Categories and Items windows shows the formula when the item is highlighted (as illustrated below).
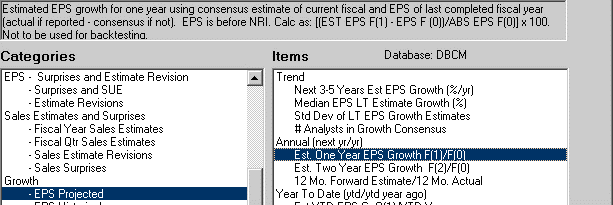
In the Calculation Expression feature, we'll create a custom item that can be backtested. The only real difference will be that; instead of using the F(0) Consensus Estimate if the F(0) Actual is not available, it'll use the previous period's Actual Earnings.
In this example: let's create a screening item that looks for stocks with greater than a 30% Projected EPS Growth Rate.
1. Go to Screen on your Menu Bar and then select Screen By Calculation Expression
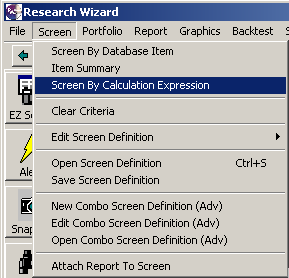
or click on the Screen By Calculation Expression button on the Toolbar.

The Calculation Expression window will then pop up.
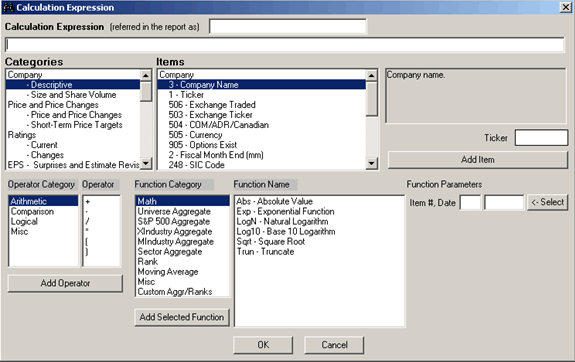
2. In the Operator Category window in the bottom left corner, select Arithmetic, then select the opening parentheses in the Operator window and then click the Add Operator button.
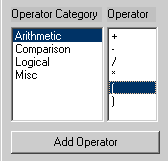
An opening parentheses will be added to the long dialogue box above the Categories window as shown below.

3. Next, scroll down to the bottom of the Categories window and select Fiscal Year Estimates. Then in the Items window, select item # 49 which is: F(1) Consensus Estimate ($/share). Once the item is selected, click the Add Item button to the right of that and i49 (item # 49) will be added to the expression. (See below.)

4. Then let's go back to the Operator Category window in the bottom left corner and select Arithmetic, then the minus sign in the Operator window and then click the Add Operator button.
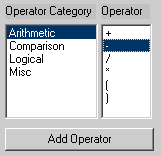
You expression should now look like this:

Tip: you can click in the dialogue box and then type out a portion of your expression or all of it without having to select and click the windows and buttons. However, it's a good idea to use the select and click method until you become more familiar with the feature and how the calculations are set-up.)
5. Next, let's go to the Categories window and select Actual, then in the Items window select item # 31 which is: EPS Before NRI ($/share). Once the item is selected, click the Add Item button to the right of that and i31 (item # 31) will be added to the expression. (See below.)

6. Then let's go back to the Operator Category window and select Arithmetic, then the close parentheses in the Operator window and then click the Add Operator button.
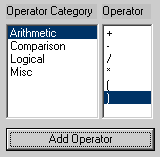
The expression should now look like this.

7. Go back to the Operator Category window, select Arithmetic, then the division ' / ' sign and then click the Add Operator button.
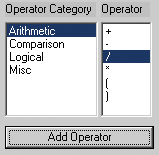
The expression should now read:

8. Next, go to the Function Category window and select the Math function. Then select the Abs - Absolute Value in the Function Name window. Once that's highlighted, click the ' < - Select ' button under the Function Parameters section. And then click the Add Selected Function button (under the Function Category window) to add this to your expression.
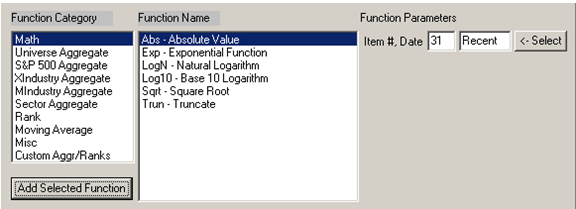
If you did it right, it should now look like this:

(We need to use the Absolute function so we can divide it properly in case i31 is a negative number.)
9. Then let's click in the dialogue box at the end of the expression and type in the asterisk ' * ' and then 100. (The asterisk can also be accessed from the Operator Category window and the Operator window. But the 100 can only be typed in from your keyboard.) (Multiplying the result by 100 turns the number into a percentage rather than a decimal.)
The completed expression should now look like this:

10. If it does, click the OK button at the bottom of the Calculation Expression window.

11. The Screen By window will then pop up. Select the 'greater than' operator, i.e., ' > ' and then type in 30 (for 30%) to define the value. (In this example, we're screening for projected growth rates of greater than 30%.) Click OK, and the Calculation is complete.
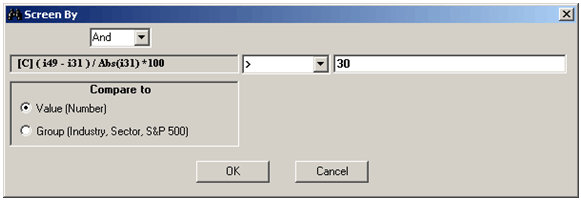
The custom item will now appear in your Screening Criteria table as well as your Report Definition table. (See below.)

This item is now ready to be backtested. Or you can add to this screen as you normally would to further narrow it down with other criteria.
Be sure to save your screen so you can access it again.
Cool Tip
If this is an item you expect to use over and over again in other screens, you can save the above calculation as a single item screen to add to other screens any time you want to add this item again.
First, save the screen as you normally would. Let's call this one: Projected Year over Year Growth
You might want to create a special folder in your Inputs Folder for your custom items. For example: let's create a Folder called Custom Items.
1. Select Screen on your Menu Bar and then select Save Screen Definition
2. Once your Screen Definition window pops up, select the Create New Folder icon.

3. A 'New Folder' folder will appear as shown below.

Type in Custom Items and then click the Save button. The new Custom Item folder will now be in the Save In: drop down box. (See below.)

4. Then in the File Name: drop down box, type in: Projected Year over Year Growth

5. Click the Save button and this screen will now be saved in the Custom Items folder.
The complete location is: C:\ZIR\Inputs\Custom Items
Here's the Cool Tip part. If you want to access this item so you can add it to another screen you're building, you can.
Let's say you're currently working on a screen that has the following items already selected as depicted below:
Zacks Rank = 1
Current Price >= 5
Volume - 20 days (shares) >= 100,000

And now you want to add the Projected Year over Year Growth item that you created in the Calculation Expression feature so you can backtest it – but you don't want to have to recreate it again the Calculation Expression feature.
All you have to do is:
1. Go to Screen on your Menu Bar and select Open Screen Definition.
At first, the Screen Definition Window will pop up with the Inputs folder as the active folder. Since we saved the Projected Year over Year Growth screen in the newly created Custom Items folder, simply double-click the Custom Items folder that's what's displayed in the Look In: drop down box. (See below.)
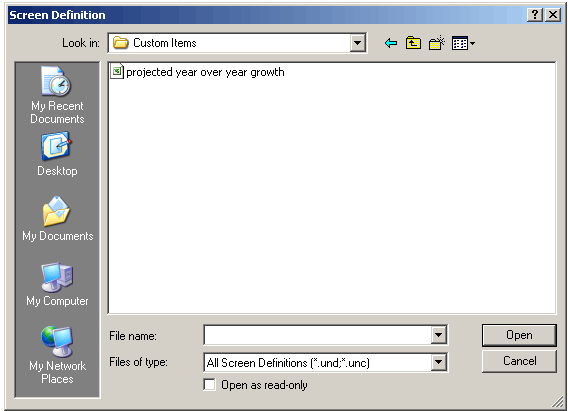
2. Then select the Projected Year over Year Growth screen and click Open.
3. A Window will then pop up asking if you want to Clear the Screen Definition. Click NO!
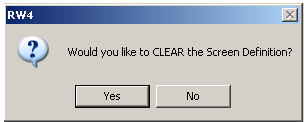
By clicking No, we're not replacing our current Screen with the newly selected screen, but instead, we're adding this screen (in this case our custom item) to the screen we've been working on.
Once you select No, another window will pop up and ask you if you want to clear the report definition. You can answer either Yes or No. If Yes, the current report will be replaced with the report that is associated with the Projected Year over Year Growth screen. If you select No, the current report will remain in place. Neither choice will have any impact on the Screen.
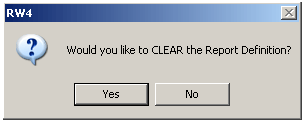
For this example, let's say Yes.
Once that's done, you'll see your custom item:
Projected Year over Year Growth, i.e., (i49 - i31 ) / Abs(i31) *100 added to your screen.

You'll see it also replaced your report if you clicked Yes to the Clear Report window. Either add the other items back in, or add one of your favorite custom reports to your finished screen.
And if you want to then backtest this new screen, be sure to give it a name and save it and you're ready to go.
Summary
Start using the Projected Year over Year Growth item in your own screens and see how it can make a difference in your strategies.
I've experimented with this item quite a bit and have found that if you go too high, it diminishes your returns. But that's for another article.
Until then, test out different projected growth rates and see how they perform for you.
Free Daily Picks from Zacks' Best Strategies
Plus, Formulas for Finding Them on Your Own
Try our Research Wizard stock-selection program for 2 weeks to access live picks from our proven strategies, modify existing screens, or test and create your own at the touch of a button. Absolutely free and no credit card needed.